 July
10
July
10
Tags
Got a computer? We have data. Let’s do neuroscience!
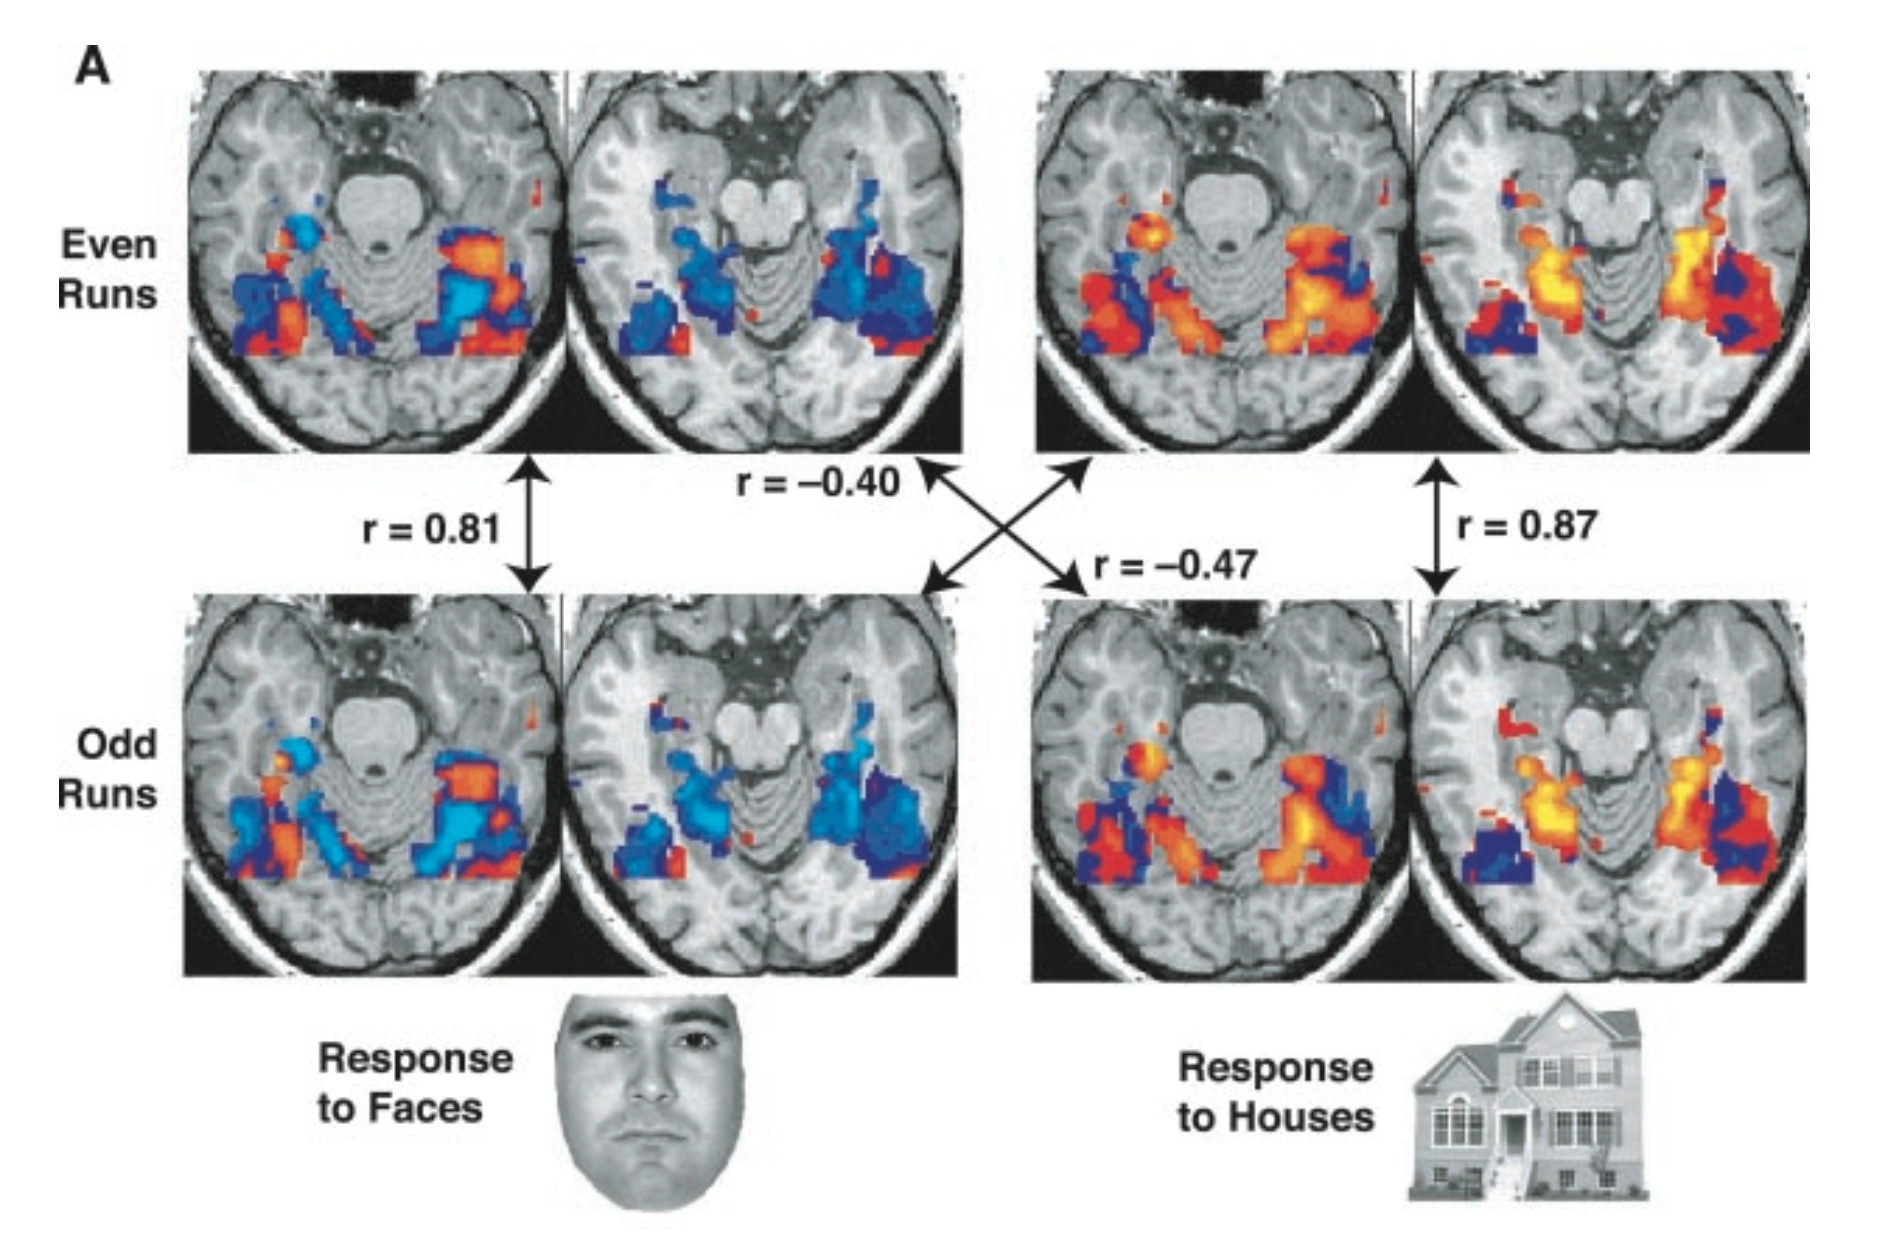
Haxby et al. (2001) introduced MVPA (multi-voxel pattern analysis), which uses the “activation” pattern across any part of the brain to read the mind.
Above, the activations to faces and houses is so consistent, you can learn the activation pattern one on half of the runs and then successfully predict the pattern in the other half of the runs (vertical arrows). In fact, in this case, the two patterns anti-correlate–the patterns are in some ways opposites! (diagonal arrows).
The data for these analyses are publicly available, with example code for doing decoding, and even performing the MVPA analysis.
Have you ever wanted to read someone else’s mind? Fifteen years ago, this sounded like science fiction. Then, neural decoding was invented (e.g. Haxby et al., 2001), and the way we think about “mind reading” changed. Now researchers regularly use basic machine learning methods to figure out what people are seeing, doing, and even thinking (Norman et al., 2006).
You can do mind reading too! Even better: now, everything you need to do mind reading–and your own neuroscience research–is freely available online. In fact, there are increasing calls to make science more open: for data to be shared publicly, for analysis code to be published, and for the widespread development and use of free, open-source software to collect and analyze all data. Indeed, the amount of data is becoming overwhelming!
The goal of this blog post is to point you to the resources out there. In order to get started, three things are necessary: data, software, and examples. I’ll provide an overview of what’s available for each, and places where you can ask questions when you get stuck!
From here, you can do your own research, you can explore other people’s results in-depth, or you can just use the tools to visualize brain activity and print amazing posters for yourself!
Open Science Initiatives in Neuroimaging
(Note: most of the public data available are MRI-based neuroimaging, so I will focus on those. People interested in single unit recordings, EEG/MEG/iEEG, please share resources via the comments below!)
The age of “big data“ is upon us. The amounts of data collected vastly outpace our ability to actually analyze that data. The datasets get so large, that they can’t be loaded into any computer’s memory. The hottest current profession is data science. Those who know how to organize, visualize, and analyze large datasets are at a massive advantage in the current job market.
Big data is also a big deal in neuroscience–and particularly MRI-based neuroimaging, such as fMRI (functional MRI), DTI (diffusion tensor imaging), and rsMRI (so-called “resting state” MRI). Datasets are being uploaded to public databases through a number of initiatives, including OpenFMRI and the Neuroimaging Informatics Tools and Resources Clearinghouse (NITRC). There are a number of funded efforts to collect old data and re-release as public databases, notably the INDI efforts (which include the popular ABIDE and F1000 datasets). In addition, funding is being allocated to collecting data explicitly for the purpose of public sharing–most visibly in the Human Connectome Project (HCP), but also in the Pediatric Imaging, Neurocognition and Genetics (PING) study, and soon the BRAIN initiative–which aims to collect data that will be a challenge to store, let alone analyze. There are even online journals specifically focused on publishing datasets (e.g. Nature Scientific Data), or have specific options to release data (e.g. F1000 “Data Notes”).
What are public datasets good for? In many cases, data are expensive to collect and require devices that are relatively rare, making data replication challenging. However, tools for doing data analysis (computers and software) are much cheaper and widespread. This makes replication of data analysis possible. It also opens up the possibility of re-analyzing data with alternate algorithms that might yield different insights. As machine learning and statistical analysis continue to march forward, the same data can continue to yield deeper or even different insights. Finally, we can combine data across datasets to increase statistical power and make discoveries that are too fine-grained for smaller datasets.
What types of data are available?
The MRI data available are 3D (x,y,z) and 4D (x,y,z, and time) “volumes” of the brain. The 3D volumes are anatomical images of the brain, and emphasize different tissue contrasts (“T1-weighted”, “T2-weighted”) or how much the tissue allows water diffusion (“diffusion-weighted”). The 4D volumes usually measure how blood flow changes over time–so-called “functional MRI” (fMRI). fMRI is frequently used to measure changes during a task (“task-based MRI” / “tMRI”), or to observe spontaneous changes when doing nothing over an extended period of time (“resting-state MRI” / “rsMRI”).
Analysis of the 3D volumes can help us compare brain structure across different groups. Analysis of 4D volumes can tell us how brain metabolism (and, likely, brain activity) differs when participants do one task versus another (e.g. an auditory task vs. a visual task), or how parts of the brain co-activate over time (even when the participants aren’t told to do anything!).

left: anatomical mri (MRI)
center: diffusion tensor imaging (DTI); colors likely indicate the principal direction of connections
right: functional MRI (fMRI); colors indicate differences in blood flow (warm colors: increase, cool colors: decrease) during different times of the scan.
Recently, algorithms were developed to extract a 2D cortical sheet from the 3D volume. The cortex is thought to be best described as a 2D surface that’s been folded to reduce connection volume, making it a wrinkled, 3D volume. By transforming the cortex back to a 2D object, these “surface-based methods” have been shown to lead to more accurate results.
There are some publicly available datasets for surface-based analyses, but Python-based support is weak. Look for a future blog-post on this topic!
What’s the best way to get started?
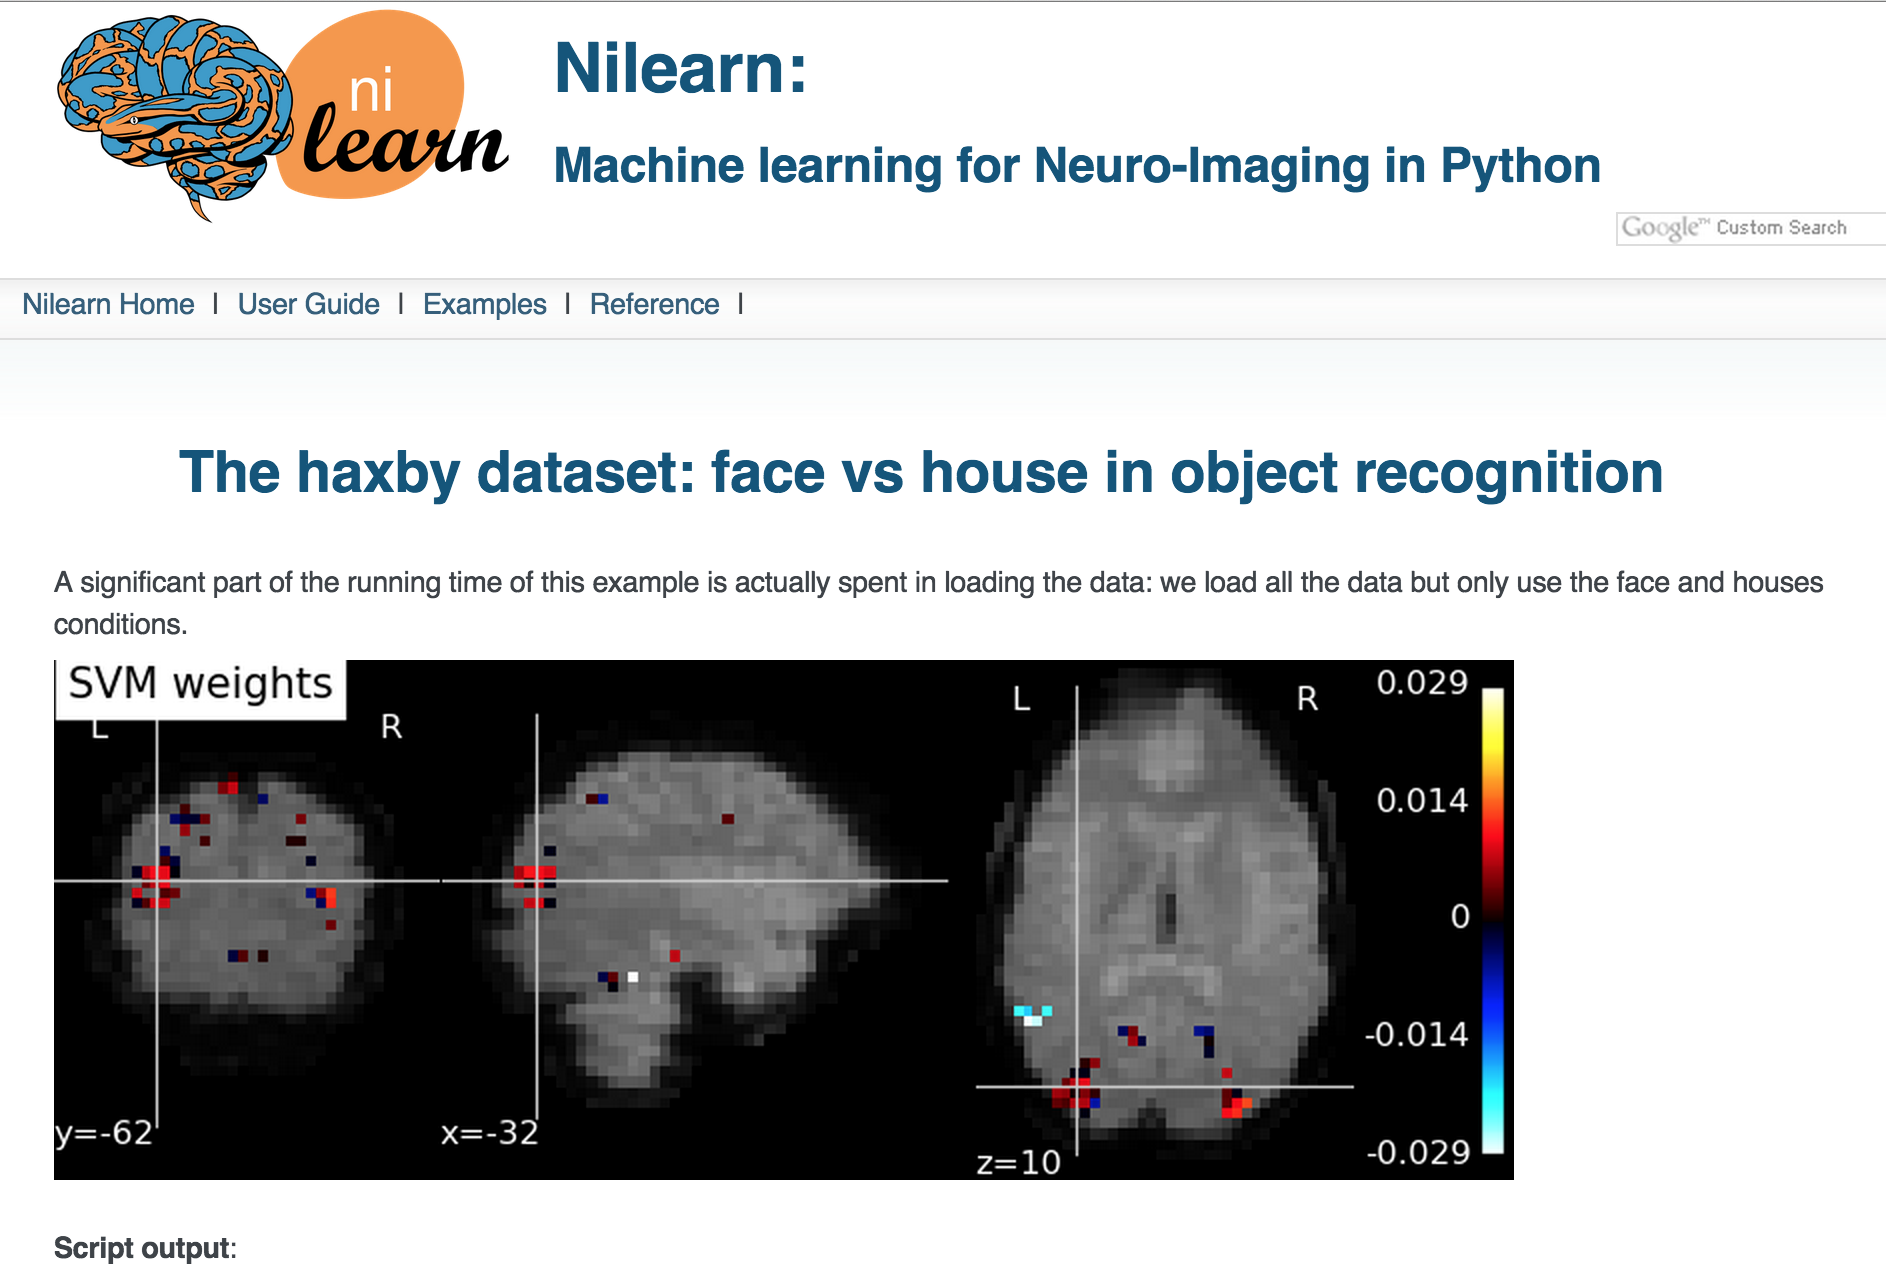
- For functional MRI datasets and analysis (including more sophisticated machine learning tools), I recommend installing nilearn and trying out some of their examples.
- For diffusion MRI datasets and analysis, I recommend installing dipy and trying out some of their examples.
- For structural MRI datasets and analysis, I recommend contributing to the nipype pipeline written to support the Human Connectome Project (HCP)’s non-Python shell. It’s a work in progress, but the HCP dataset is amazing! Stay tuned–better examples will be coming to the nidata package soon!
- For questions and support, post a question to the NeuroStars website, or to the nipy user’s list.
Where do I get the data?
Open data are quite scattered across a number of websites and databases at the moment, with no common underlying data format and no common method for accessing the data. This sucks; data aren’t really open unless they’re easy to find and access.
For this reason, I’ve been developing a tool called nidata. Nidata is a Python package that gives you a single function to access data from a variety of open data sources. You call the function, you say how many subjects you want, and the tool will download the necessary files, convert them into a standard format, and return them to you. Easy!
The best current (and actively updated) database for data sources and available experimental data is at nidata’s “data sources” wiki page. Below is a table of major current data sources (multi-study databases and large, notable single-study websites).
Another interesting tool under development is datalad. Datalad also knows about various data sources. It exposes those resources to you via a tool called “git-annex”. You simply “clone” the data source, and you get pointers to all the remote data. When you’re ready to analyze a particular file, you just tell git-annex to fetch the file “for real” to get a local copy.
What analysis software is available?
Why use python? Sadly, MATLAB is a semi-standard for academic programming. Code written in MATLAB code is not truly “open”, as it requires a paid program to use it ($99 for student licenses, up to $500 for non-student licenses). Python is a freely available, open-source scripting language with lots of support for data analysis (e.g. the ‘pandas’ package) and machine learning (e.g. the ‘scikit-learn’ package). Python is also a much more capable language than MATLAB, making file downloads and data munging much simpler than MATLAB. I will completely focus on Python here.
The major Python project for neuroimaging is nipy (NeuroImaging for PYthon). Nipy contains a number of Python packages for loading, visualizing, and analyzing neuroimaging data. These include Python wrappers for common non-Python processing packages, such as SPM (MATLAB code for processing volumes) and FreeSurfer / FSL (C/C++ code for extracting and analyzing cortical surfaces).
The best thing about these packages is that they provide examples, so that people unfamiliar with the details of how each neuroimaging type are collected or stored, but have some ideas about how they want to analyze data, can get started quickly and learn from working code.
I will highlight three packages that have particular utility to data analysts:
nilearn
Nilearn’s goal is to provide simple interfaces for people to apply machine learning to neuroimaging data. The nilearn package also contains most of the best visualizations for raw data and processed results. Nilearn is built on top of Python’s machine learning package, scikit-learn (and some of the authors of scikit-learn have made large contributions to nilearn).
dipy
Dipy is nominally focused on diffusion imaging (and contains a slew of state-of-the-art algorithms), but has also excellent code for image pre-processing (removing superfluous things, such as the skull, and registering all brain images to overlap as much as possible, which aids analysis).
nipype

Nipype provides a common interface for interacting with a number of common processing pipelines–including those that are not written in Python. This means that you can easily include analysis using non-Python tools within in your Python scripts–meaning you can do pre- and post-processing steps (such as visualization) smoothly in a single Python script.
Putting it all together
To recap, a great place to begin is the nilearn neuroimaging library. The installation is much simpler than most packages, and they have short, end-to-end example scripts that even download the datasets for you!
Other resources
MRI resources:
There are a number of freely available courses on neuroimaging analysis in general, to get familiar with the data collection, standards for preprocessing of the data, and basic analyses. These include:
- UCLA’s neuroimaging summer school video lectures
- Coursera course on fMRI statistical analysis
- FSL / FreeSurfer (two major MRI free software packages) course on fMRI analysis
Data analysis resources:
- Scipy is the preeminant conference for Scientific Analysis in Python. Besides checking out the conference website, I recommend taking a look at the conference videos.
- There are many, many places to learn data science via Python. LearningWithData is one that I personally use.
References
- Abraham, A., Pedregosa, F., Eickenberg, M., Gervais, P., Mueller, A., Kossaifi, J., … Varoquaux, G. (2014). Machine learning for neuroimaging with scikit-learn. Frontiers in Neuroinformatics, 8, 14. http://doi.org/10.3389/fninf.2014.00014
- Hanke, M., Halchenko, Y. O., Sederberg, P. B., Hanson, S. J., Haxby, J. V., & Pollmann, S. (2009). PyMVPA: a Python Toolbox for Multivariate Pattern Analysis of fMRI Data. Neuroinformatics, 7(1), 37–53. http://doi.org/10.1007/s12021-008-9041-y
- Haxby, J. V., Gobbini, M. I., Furey, M. L., Ishai, A., Schouten, J. L., & Pietrini, P. (2001). Distributed and Overlapping Representations of Faces and Objects in Ventral Temporal Cortex. Science, 293(5539), 2425–2430. http://doi.org/10.1126/science.1063736
- Norman, K. A., Polyn, S. M., Detre, G. J., & Haxby, J. V. (2006). Beyond mind-reading: multi-voxel pattern analysis of fMRI data. Trends in Cognitive Sciences, 10(9), 424–430. http://doi.org/10.1016/j.tics.2006.07.005

Very nice post! Thank you!
“Putting it all together” is IMHO is incomplete without mentioning NeuroDebian (http://neuro.debian.net) through which majority (or almost all) of the above mentioned software resources available, including the Haxby 2001 data. Within minutes, even you are using OSX or Windows (VirtualBox appliance is there waiting for you), you can get visualize and crunching neuroimaging data and share your environment (if in VirutalBox) with your colleagues.
Moreover, I would like to note another project of ours, PyMVPA (http://pymvpa.org), which provides a very feature-full framework for analysis of neural data of all kinds. Besides unique methods, such as Hyperalignment (again from Haxby group), it integrates functionality from other toolkits such as MDP, scikit-learn, etc making it probably the most versatile (and possibly most popular) toolkit out there for neuroimaging data analysis. Tutorial (http://www.pymvpa.org/tutorial.html) can gently guide you in 😉
Great, thanks for sharing them @yarikoptic! I should try all those resources out and hope others do!
Another cool approach: iPython Notebooks running in the cloud, with simple methods to download and process datasets on Amazon AWS. Not too much data there now, but you can help change that! http://notebooks.codeneuro.org/
There’s a nice set of videos to help get started: https://www.youtube.com/playlist?list=PLEAaDzXEsWpm4srxa5Xs4OxSiRc-wh4uP
Pingback: Remembering Oliver Sacks | NeuWrite San Diego
Pingback: Cognitive Science to Data Science | Jeremy Karnowski
Pingback: I’ve got big data on my half-mind with Dr. Ben Cipollini, UCSD | the wet lablog