 February
06
February
06
Tags
What’s my (brain) age again?
What does it mean to age? Is it a purely time-based process, with each passing moment bringing our bodies along an invariant trajectory of decline? Or is it a function of our behavior, dependent on our daily activities and the damage inflicted upon ourselves over time? Clearly, there is a bit of truth in each of these ideas. On one hand, aging is a time-dependent process that is unavoidable; we all grow old and eventually our bodies stop functioning. On the other hand, not everyone ages the same. Our bodies accumulate damage at different rates, and sometimes the aging process is even hijacked by underlying pathology and accelerated (like in neurodegenerative disease). For this reason, researchers studying the aging processes have defined biological age as separate from chronological age. While chronological age refers to the amount of time one has been alive, biological aging has been broadly defined as a functional decline over time that results from the accumulation of cellular damage, and this process can be sped up or slowed down by many other factors (like our genetics and lifestyles). Thus, two people with the same chronological age can have different biological ages, and the latter may be a better indicator of risk for age-associated health issues.
Interestingly, the past decade has seen a growing trend in neuroscience aging research on the idea of “brain age”. A more specific form of biological age, this is considered a marker of an individual’s brain health relative to healthy individuals of the same age, and has been increasingly used to assess risk for age-associated neurodegenerative and psychiatric diseases. The first, and still most commonly used method for this purpose, is called the Brain Age Gap Estimation (BrainAGE) method, which uses magnetic resonance imaging (MRI) to assess a person’s individual brain age [1].
Using Brain Scans to Predict Age
BrainAGE uses structural MRI, a relatively quick and non-invasive way to collect information about the anatomy of a person’s brain. After collecting brain scans from a large sample of healthy individuals, BrainAGE uses a type of statistical analysis called machine learning to teach a computer program how to predict the subjects’ ages based on the information in the scans. After training the program to associate patterns of data from the scans with chronological age, the same program can be given new, previously unseen brain scans in order to make age predictions. Interestingly, the real outcome measure here is the difference between the predicted age and the person’s actual chronological age: this difference is the brain age gap. A positive age gap (meaning the prediction was greater than than the chronological age) suggests advanced aging, whereas a negative age gap (meaning the prediction was less than the chronological age) suggests delayed aging. For example, if a 60 year old individual shows a BrainAGE score of +5, the pattern of information in their brain scan resembles that of a 65 year-old.
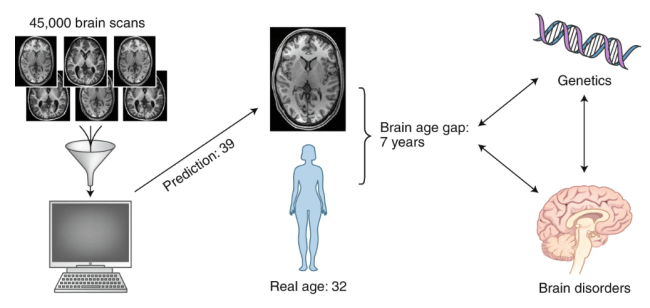
from [2]: “Calculating the brain age gap.” Structural brain imaging from healthy individuals are used to train a machine-learning algorithm to learn typical brain aging trajectories. The algorithm can then be used to predict brain ages of people with or without various brain disorders. The brain age gap, which is the difference between the predicted age and the person’s real age, has been shown to be higher in people with certain disorders, and linked with genetics.
But HOW can a computer program even associate patterns of MRI data with age? The reason this method works is because of the fact that the brain changes as we age in ways that are somewhat predictable and reasonably consistent among individuals. These changes are characterized by coordinated and sequential patterns of development (such as cell growth, myelination, and synaptic pruning) early in life, followed by patterns of degeneration (such as brain atrophy) later in life. By collecting data from large enough samples of people, BrainAGE is actually pretty accurate. The typical way researchers test the accuracy of their prediction programs is through a method called “cross-validation”, where they use a large portion (but not all) of their healthy reference sample to train the program in the first place, and then test the program on the remaining healthy subjects in that sample to see how accurate it is in predicting their true ages. The most accurate measures have been from studies modeling brain changes in development (early childhood and young adulthood), where the average error is about one year [3-5]. Studies modeling brain aging in older adults are slightly less accurate, with an average error of about 4-5 years [1;6-7].
BrainAGE in Neurodegeneration
One area in which a reliable measure of brain aging would be of great clinical value is the study of pathological neurodegeneration, especially dementia. As our global population ages, there is a growing prevalence of age-associated functional decline and neurodegenerative diseases such as Alzheimer’s disease (AD), for which age is the strongest risk factor. One major obstacle in AD research currently is that by the time people are showing symptoms of dementia, the damage in the brain has already been done. Ultimately, we need to find ways to predict who is at greatest risk for developing the disease, and treat them proactively. BrainAGE could potentially be a great help in this endeavor.
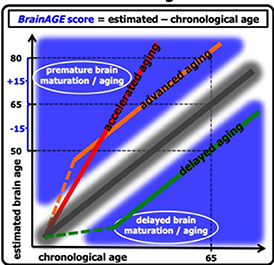
From [1]: “The difference between the estimated and chronological age results in the BrainAGE score, with positive BrainAGE scores indicating advanced brain aging (orange line), increasing BrainAGE scores indicating accelerating brain aging (red line), and negative BrainAGE scores indicating delayed brain aging (green line)”
Next, they used BrainAGE to see if they could predict whether people with mild cognitive impairment would convert to AD [9]. They included 195 people with mild cognitive impairment at baseline, of whom 133 were later diagnosed with AD over 36 months of follow-up. Those who did not convert had average scores of +0.7, while those who converted within one year had average scores of 8.7, and those who converted within two years had average scores of 5.6 years. As before, there was a tight relationship between advanced brain aging and worse cognitive functioning. Importantly, their predictions on conversion to AD within the first follow-up year based on baseline BrainAGE scores had an accuracy of 81%, which was more accurate than other risk factors commonly assessed such as chronological age, hippocampal volumes, cognitive scores, and cerebrospinal fluid biomarkers.
Other Lifestyle Factors Affecting BrainAGE
 Other studies which focused on protective interventions for brain aging have found some interesting associations between lifestyle factors and brain age. For example, Luders et al. (2016) found that the BrainAGE scores in long-term meditators were ~7.5 years lower than in control subjects [10]. Additionally, Rogenmoser et al. (2018) found that musician status has a significant effect on brain age: amateur musicians had BrainAGE scores of -4.5 +/- 6.8 years, whereas professional musicians had scores of -3.7 +/- 6.6 years (compared to non-musician scores of -0.5 +/- 6.8 years). The authors postulated that a possible explanation for the professional musicians having higher brain age scores than the amateur musicians was stress-related interferences [11].
A Decade of BrainAGE
The past ten years of research into BrainAGE as a marker of brain health has provided some pretty interesting insights into how various lifestyle and disease factors affect the aging brain, but we still have a long way to go before being able to use this tool clinically. The whole machine learning process is still a bit of a black box; while we can predict one’s “brain age”, we still don’t really know what it is specifically about their brain that has caused delayed, advanced, or accelerated aging. In the meantime, however, the ability to accurately and reliably obtain a measure of one’s general brain health has great promise for teaching us about the positive or negative effects of all kinds of life circumstances on age-associated brain changes. As research in this area continues, this tool may be able to help us predict which people might be at risk for advanced or accelerated aging, like in the case of dementia, and could potentially serve as an evaluation of preventative and therapeutic trials for patients.
References
- Franke K, Ziegler G, Klöppel S, Gaser C; Alzheimer’s Disease Neuroimaging Initiative. Estimating the age of healthy subjects from T1-weighted MRI scans using kernel methods: exploring the influence of various parameters. Neuroimage. 2010;50(3):883–892. doi:10.1016/j.neuroimage.2010.01.005
- Bijsterbosch, J. How old is your brain?. Nat Neurosci 22, 1611–1612 (2019) doi:10.1038/s41593-019-0478-0
- Brown TT, Kuperman JM, Chung Y, et al. Neuroanatomical assessment of biological maturity. Curr Biol. 2012;22(18):1693–1698. doi:10.1016/j.cub.2012.07.002
- Erus G, Battapady H, Satterthwaite TD, et al. Imaging patterns of brain development and their relationship to cognition. Cereb Cortex. 2015;25(6):1676–1684. doi:10.1093/cercor/bht425
- Franke K, Luders E, May A, Wilke M, Gaser C. Brain maturation: predicting individual BrainAGE in children and adolescents using structural MRI. Neuroimage. 2012;63(3):1305–1312. doi:10.1016/j.neuroimage.2012.08.001
- Liem F, Varoquaux G, Kynast J, et al. Predicting brain-age from multimodal imaging data captures cognitive impairment. Neuroimage. 2017;148:179–188. doi:10.1016/j.neuroimage.2016.11.005
- Schnack HG, van Haren NE, Nieuwenhuis M, Hulshoff Pol HE, Cahn W, Kahn RS. Accelerated Brain Aging in Schizophrenia: A Longitudinal Pattern Recognition Study. Am J Psychiatry. 2016;173(6):607–616. doi:10.1176/appi.ajp.2015.15070922
- Franke, K., Gaser, C., & Alzheimer’s Disease Neuroimaging Initiative. (2012). Longitudinal changes in individual BrainAGE in healthy aging, mild cognitive impairment, and Alzheimer’s disease. GeroPsych: The Journal of Gerontopsychology and Geriatric Psychiatry, 25(4), 235–245. https://doi.org/10.1024/1662-9647/a000074
- Gaser C, Franke K, Klöppel S, Koutsouleris N, Sauer H; Alzheimer’s Disease Neuroimaging Initiative. BrainAGE in Mild Cognitive Impaired Patients: Predicting the Conversion to Alzheimer’s Disease. PLoS One. 2013;8(6):e67346. Published 2013 Jun 27. doi:10.1371/journal.pone.0067346
- Luders E, Cherbuin N, Gaser C. Estimating brain age using high-resolution pattern recognition: Younger brains in long-term meditation practitioners. Neuroimage. 2016;134:508–513. doi:10.1016/j.neuroimage.2016.04.007
- Rogenmoser L, Kernbach J, Schlaug G, Gaser C. Keeping brains young with making music. Brain Struct Funct. 2018;223(1):297–305. doi:10.1007/s00429-017-1491-2

You must be logged in to post a comment.