Tags
A brave foray into the daunting complexity of the human cortex
Understanding the organization of human cortex has proven to be more difficult than examining that of other animals. For instance, we are more limited in the methods we can use to investigate human cortical networks. Brodmann attempted to classify and name human cerebral cortex by studying the cytoarchitecture of post-mortem brains; his legacy was a nomenclature defining 50-odd regions and the bane of neuroscience undergrads everywhere. While his system is useful in providing a way to communicate about the same brain regions, it is important to note that it offers no insight into how these areas are interconnected or functionally related. Modern human neuroimaging techniques can provide some insight into the functional connectivity in the human brain and the complex behaviors and states that different cortical networks subserve.
Randy Buckner and colleagues use functional connectivity MRI (fcMRI) to investigate the intrinsic networks within human cortex. They aimed to create reference maps that would best describe the functional connectivity of human cortex and how distributed cortical networks are organized. FcMRI measures intrinsic functional relationships between brain regions using temporal correlations in regional activation. Of course, it is important to note that fcMRI provides no information about the directionality of the connections and is influenced by the prior history of activation.
The investigators collected data from 1000 subjects that were run in a 3T MR scanner. They used 3 different passive state tasks: eyes open (EOR), eyes closed (ECR), and fixation (FIX). The authors also used visual stimulation to map out the retinotopic maps of early visual areas. In their first set of analyses, they used a clustering algorithm to segregate the cortex into functionally coupled areas. They identified 7 and 17 (in a finer analysis) networks. In subsequent analyses, they examined the organization of sensory, motor, and association cortex networks.
Buckner and colleagues found that the functional properties lower-level sensory and motor networks were very different from higher-order association cortices. Sensory and motor networks were organized in a topographic and hierarchical way and tended to form local networks. On the other hand, higher-order association areas were organized into multiple, distributed networks without a clear hierarchy.
Specifically, for visual cortex, the authors found that early visual areas were strongly coupled to each other and only very weakly coupled to areas outside of the visual cortex. They also found that they could divide the areas in early visual cortex, such as V1-3 and V4v, into central and peripheral components (using a visual stimulation task to map out retinotopy).
Buckner and colleagues then found that the somatomotor network, like visual areas, comprises of preferentially locally coupled areas organized in a clear hierarchy (see Figure 29). Figure 29 examines this network and explores several possibilities for its hierarchical organization (with B and C being the best arrangements). These analyses demonstrated the presence of a dorsoventral division of the somatomotor network. The authors postulated that this division might reflect the boundary between the face and body representations in cortex. Moreover, the authors chose to focus on the functional connectivity between areas MT+ and aMT+ and parietal and frontal association areas. Figure 25B shows the correlations between areas MT+ and aMT+ and 4 visual, 4 parietal, and 2 frontal regions. Buckner and colleagues found that activation in MT+ had a stronger correlation with early visual cortex relative to aMT+, while aMT+ had stronger correlations with parietal and frontal regions.

Figure 29. Functional connectivity estimates of the hierarchical organization of a canonical sensory-motor pathway. A: 6 seed regions arranged into a 5-level functional hierarchy using the replication data set. B and C: 2 best hierarchical arrangements of the seed regions as measured by the proportional of violated hierarchical and lateral constraints. A violation occurred when the ordering placed more strongly correlated regions farther apart in the hierarchy than more weakly correlated regions. D and E: 2 poor hierarchical arrangements of the seed regions as measured by the proportion of violated hierarchical and lateral contraints. Relative ordering of the seed regions (A and B) within the functional hierarchy agrees well with the proposed macaque visual hierarchy.
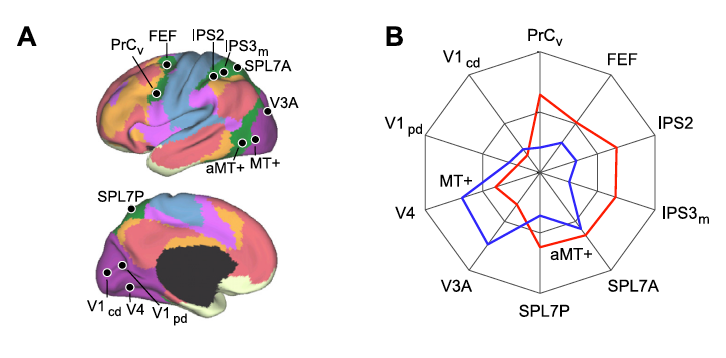
Figure 25. A: 4 visual, 4 parietal, and 2 frontal seed regions were used to quantify the functional coupling of aMT+ and MT+ to distributed cortical regions. B. polar plots of MT+ (blue) and aMT+ (red) connectivity with the visual, parietal, and frontal seed regions were computed using the replication data set. (from Yeo et al., 2011).
In higher-order association cortex, the authors found multiple, parallel distributed networks (7 and 17). Among the networks they discovered, the dorsal/ventral attention networks, the frontoparietal control network, and the default network were analyzed in greater depth. Buckner and colleagues generally found that these large scale, distributed networks were interdigitated and presented evidence for some cross-talk between these networks.
Please join us on Tuesday Feb. 19 as Randy Buckner discusses how modern MRI methods can illuminate the intrinsic functional connectivity of human cerebral cortex. Seminar will be held in the CNCB Large Conference Room at 4pm.

Laura Sancho is a first-year neuroscience PhD. student currently rotating in Jeff Isaacson’s lab. She enjoys systems neuroscience and electrophysiology.
Thomas Yeo B.T., Krienen F.M., Sepulcre J., Sabuncu M.R., Lashkari D., Hollinshead M., Roffman J.L., Smoller J.W., Zollei L. & Polimeni J.R. & (2011). The organization of the human cerebral cortex estimated by intrinsic functional connectivity, Journal of Neurophysiology, 106 (3) 1125-1165. DOI: 10.1152/jn.00338.2011

You must be logged in to post a comment.